How to use Data Driven Therapy
1.) The first step is to register for an account on Data Driven Therapy. Don't worry, MyndTek does not currently share any of your information with any outside parties and will not without your express consent.
2.) Every day at the end of the day, log into the Data Driven Therapy application and complete your mood log. This will allow the HIPAA compliant system to help you track your mental health progess and identify trends.
3.) Go to the Your Data page and look at the various charts of your data that are available, and any of the potential risks that the system may identify.
4.) If you are using one of our physical health monitoring devices or one compatible with our system, you may log in to the online terminal and import your physical health data.
This is where the beauty and true helpfulness of Data Driven Therapy comes in to play as Data Driven Therapy;s accuracy and ability to predict issues before they arrive is greatly enhanced with the addition of one of our wearable devices.
6.) After importing your physical health data, review the charts that reflect how your sleep, heart rate, activity, and data points affect your mental health.
The Charts
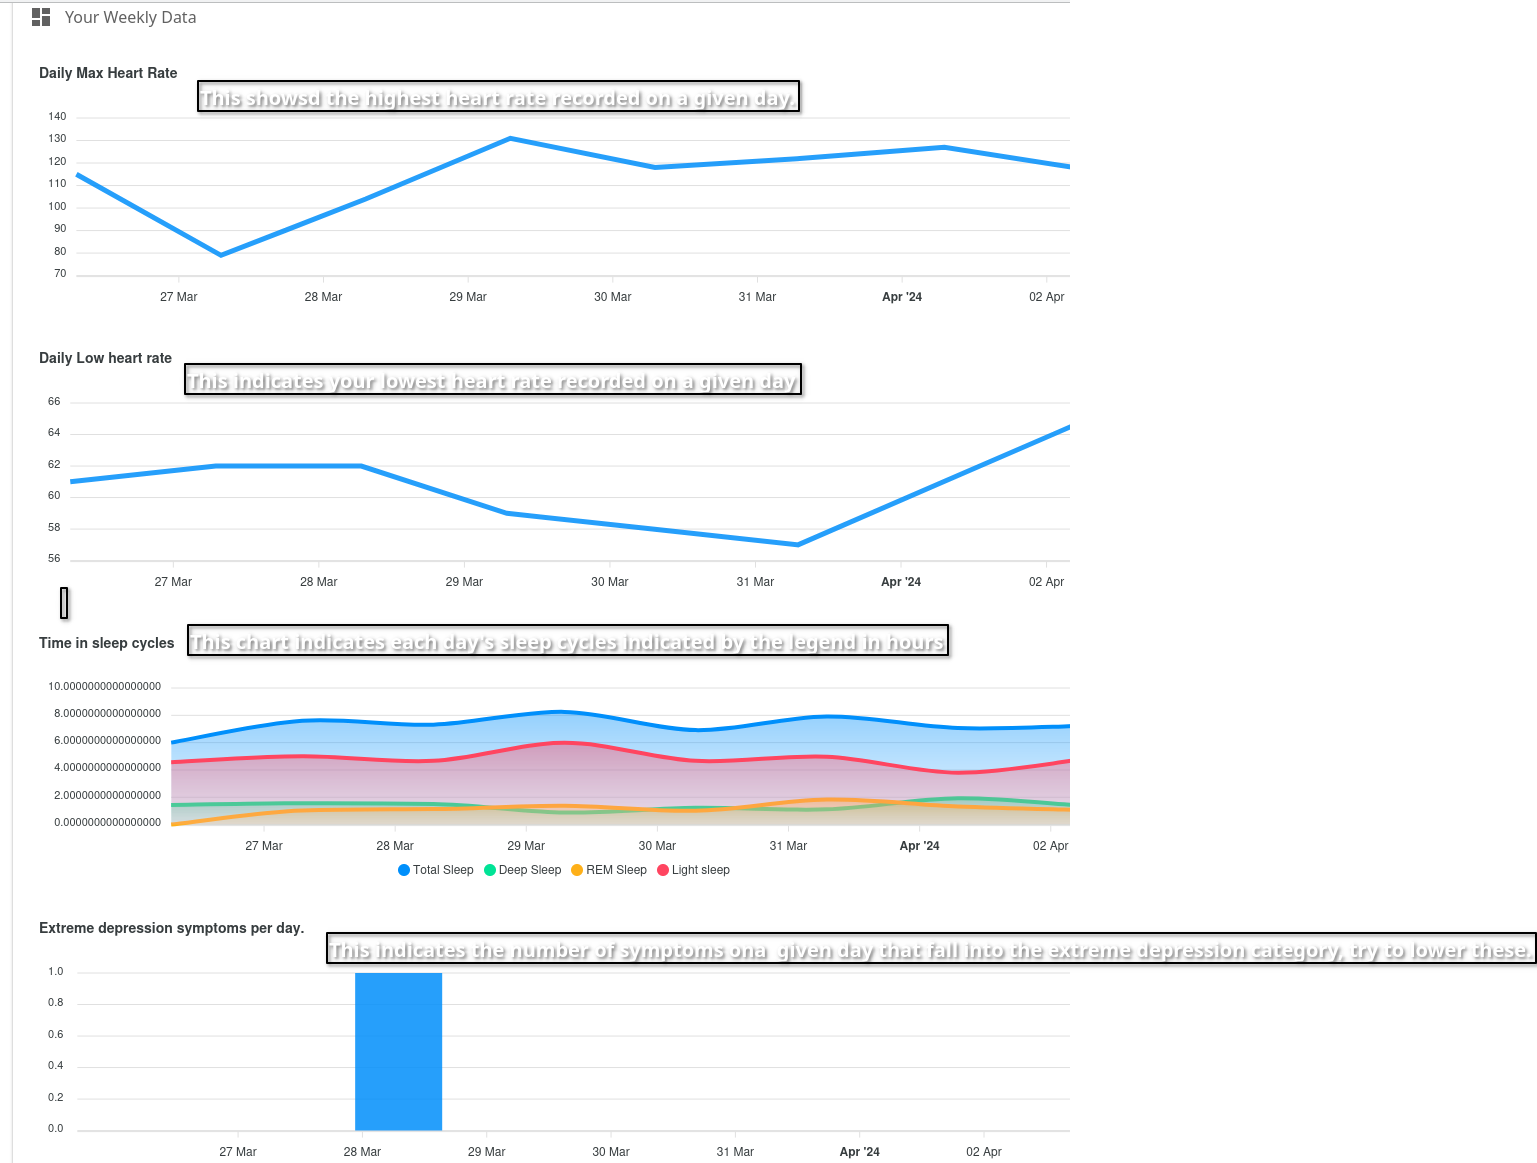
The first 2 charts in the weekly summary chart indicate the highest recorded heart rate on the indicated day (the X-axis represents the date in most charts, with Y being the value being measured such as highest heart rate etc The next chart down displays your sleep cycle data. The legend along the bottom of the chart tells you what color relates to your Deep, REM, Light, and Total sleep in hours. The remaining bar charts indicate the number of symptoms recorded in each category on the given day for Extreme, Severe, Moderate, and Mild depression and mania in addition to a chart indicating days with no symptoms.
The depression chart scores are a recorded score of the depression questionaire which you will be prompted to complete every other Saturday. The scores do map directly to a psychiatric intake form called a PHQ-9. The depression questionaire is not considered a PHQ-9 form however the scores are very closely related. Here is a link to some information about PHQ-9 forms: PHQ-9 on wikipedia The trauma report chart displays the scores from trauma reports which in the same vein as the depression reports closely resemble a psychiatric PCL-5 and your scores are displayed similar to the way that the PCL-5 form is scored. For more information on the PCL-5 view the following link: PCL-5 on ptsd.va.gov
Data Logs
In the data upload section selected from the navigation bar on the left hand side of the page, we will log your daily data.
The first step is to go through each of the sections and check the box next to any of the symptoms you hve felt at anytime during the day.
Once you have reviewed all of the symptoms and checked off all of the symptoms you have felt at any time during the day, click on the blue Save Data
button at the bottom of the page.
After (or before if you'd rather), click on the Import your wearable data panel to show the dialog to upload the data from your Garmin based
wearable device. In the username field, enter the email address that you used to setup your Garmin device and then the same password
that you used to setup your Garmin account (or whatever you may have changed it to). After you input your email address and password and exit
the password box you will be able to enter the dates that you would like to upload your wearable device data for. The default dates are from the
previous 2 days, but you may import data for any date range that you wish. When you are happy with your date range selection, click on the
Import your wearable device data button and wait until a dialog appears telling you that your data has been imported and is now available
in your dashboard.
This image below indiates what data the charts are putting into a visual representation.